The plot in the banner image of this post shows two histograms. These histograms show the distribution of marks (in the percentage of total) obtained by students attempting exams conducted by the Mumbai University in the years 2019 and 2020. In 2019, the exams were held offline. In 2020—the start of the COVID era—due to the pandemic, the exams were held online.
If you are thinking “How can you make such a sweeping, audacious statement?”, all I need for a rebuttal is the histogram. I know not everyone cheated in the literal sense, but if you look at the 2019 histogram, you can see that it is a pretty normal-looking distribution. In stark contrast, the 2020 distribution looks rather abnormal. So, depending on the extent of your cynicism, either everyone cheated, or became geniuses while sitting at home.
Here are some stats: In 2019 if you procured above 80%, you would be ahead 97% of all the students who gave the exams. But in 2020, you would not even cross the bottom 50% of the students.
This article is going to about exploring this event of mass expedience by figuring out who cheated how much. You don’t need to ask the students if they copied, plotting their distributions is sufficient, after all, data doesn’t lie.
There are going to be two parts to this article:
- Where I show you the data to further substantiate my claims.
- A few thoughts regarding this phenomenon and undergrad studies in general.
Note: Before flaming me for ratting you out, please go through the second part 🙏
Data Doesn’t Lie 🙊
The banner image was a histogram of percentages, for the rest of the article, I’ll using GPAs instead of percentages.
The reason for this is: GPA is the primary measure used for evaluating a student’s academic performance. Another reason is that the calculation of GPA involves the credits assigned to a subject. These credits determine the subject’s importance. Hence unlike percentage, the GPA is weighted by the importance of a subject.
Here’s a quick box plot to reiterate the point that everyone cheated:

Explanation: The vertical lines of the box show the first, second, and third quartile (25%, 50%, and 75%) from left to right. The vertical lines extending from the left and right sides of the box (the whiskers) show the min and the max values. Finally, the black dots show the outliers.
Plot Comment: In 2020 if you got a GPA below ~6.5 you’re an outlier.
What even is the data? 🧐
I have shown you two different plots, and have not even properly introduced the data, apologies.
Contents: The data consists of scores from 16 different courses, 8 of which are engineering (B.Tech). For each of them, there are scores of a single semester from the two years (2019, 2020). For a single course, the same semester has been used for both years. For example, for the B.Ed course, there are third-semester marks from years 2019 and 2020. All engineering courses’ data is from semester 7. All of this data was obtained from mumresults.in (may show different results now).
When was it held: The months of 2019 and 2020 examinations depend on the branch. Most of the 2020 examinations were held either in late 2020 (around December) or early 2021 (before March). The 2020 examinations were delayed because the university hadn’t yet decided upon how to cope with the situation. The pre-June semester examination of 2020 did not take place, these marks were aggregated from the previous semesters, i.e. Corona-pass. The post-June 2020 exams were held, their marks were not an aggregate of the previous semesters. This data is from the post-June 2020 exams. These exams, including externals (such as vivas), were held online.
How was it held: The method for proctoring may have been different across colleges and branches. The go-to method was to invigilate the students by having the students keep their cameras on. There was no central portal managed by the Mumbai University for conducting the exams, this was left to the college.
To get a better idea of the distributions let’s look at some count plots:

Explanation: The number inside the bar shows the exact count.
Plot Comment: There were slightly more students in 2020 (75,299) than in 2019 (72,861). In both the years, the number of guys was more than the number of girls, but not by much. Finally, the number of engineering students has been roughly half of the number of non-engineering students.
Let’s look at more fine-grained count plots:

Explanation: The number on the right of the bar shows the total count, i.e. sum of the count of both the genders. Low saturation shows male count. High saturation shows female count. Blue is 2019 and pink is 2020.
Plot Comment: A large portion of the data pertains to B.A and B.Com courses. Most of the girls are in non-engineering courses, the starkest difference in gender count (majority girls) being in B.Ed. Also, note the dearth of girls in Mech. There is one master's course, Masters in Management Studies (M.M.S) included in the data.
I wanted to include more but either their pdfs were intractable, or the page count was too low to be meaningful.
Note: These count plots included students who were given a 0 GPA due to being absent or otherwise. These 0 GPA values weren't considered while deriving the rest of the stats in the post.

Explanation: The left plot is a density plot, it is similar to a histogram (right), but a bit easier to interpret while being less accurate. You can think of a density plot as a smoothened histogram.
Plot Comment: Here’s the GPA distribution across all the collected data along with the distribution in the banner image which is a histogram of percentages. The banner distribution excludes B.A because I couldn’t obtain the max total marks for this course. Note how the percentage distribution is different from the GPA one, this is because of the way GPA is calculated. Scores above ~80% would procure a GPA of 10. This causes the GPA distribution to look like a quarterpipe rather than a mountain.
Note: For all upcoming distributions, I’ll be using density plots. This is cause GPA values aren’t continuous like percentages are (since GPAs are calculated by bucketing subject scores), and so GPA histograms tend to not be very pretty or interpretable.
There are many ways to group the data to compare the distributions. Evaluating plots by their visual characteristics is imprecise because this depends on the count of data points in the distribution. This count can be different for the two groups being compared. Wouldn’t it be nice if we had a single number that gave an idea of to what extent a group has succeeded in their cheating efforts?
The Expedience Measure ψ
Note: This section suggests math. If you don’t want to go through it, it’s cool, I understand. Just know that when you see this trident-looking symbol: ψ, it indicates the extent to which a group cheated (and succeeded in doing so). So if a group of students (A), has a higher ψ value than another group (B), chances are that A cheated more than B.
To deal with a large number of distributions in this post, I’m going to introduce a single number measure called expedience. Expedience is the extent to which a collection of students may have resorted to ‘amoral’ means for achieving academic excellence.
To calculate expedience we need a few measures that describe a distribution. For this, the mean, skew, and concentration of a distribution are going to be used. Don’t worry about how these measures are calculated, the important thing is to notice how different distributions having different values of these measures look.

- Mean (μ): For the collected data, this will tell us how much the distribution (2020 scores) has shifted with respect to a reference (2019 scores). In the case of expedient students, the mean will shift to the right (i.e. higher scores).
- Concentration (c): This is the shows how concentrated the values of a distribution are about its mode (a type of average like mean and median). If the distribution has a slender and tall peak, the concentration will be higher than if it has a short and stout peak. If a group of students is being expedient, for example by copying from each other or a common source, they all will score similar marks, i.e. their marks will be concentrated around a certain region.
- Skew (s): You can think of this as the tilt of a distribution away from the center (mean). If a large number of students are obtaining higher scores, the distribution will tilt towards the right, i.e. towards the higher scores. This will cause a negative skew. For a normal distribution, the skew will be 0.
Note: Concentration is a measure that I made up for the purpose of this post, initially I was going to use kurtosis, but kurtosis doesn’t indicate concentration, it represents outliers.

Expedience (ψ)
Using the above 3 measures of individual distributions, we can calculate expedience. It is denoted by ψ because all legit math equations have some Greek in them, and this is a very legit equation.

Basically, expedience is the weighted sum of the difference of the measures between the target distribution ‘X’ (2020 scores) and the reference distribution ‘R’ (2019 scores). In the equation ‘m’ is the max possible value of the distribution; for GPA this is 10.
To understand why expedience is calculated the way it is, please check this notebook.
Let’s look at some distributions 👀
Now that we have a measure (ψ) to compare the scores of groups of students, let's do exactly that!
The age-old question, 👦 vs. 👧 who wins?
It’s a known fact that girls are better at academics than boys. Why? There are some theories. Anyways, here are some distributions that double down on this:

Plot Comment: From the mean (μ in the legend), in both 2020 and 2019 exams, girls are ahead of the boys. In 2020 the mean for both come really close, but the girls win out. Cheating, in a way, acts as an equalizer.
Another thing to notice is that girls are not only better at sincerity (comparison of 2019 distributions), but they are also better at cheating, they have a higher ψ score. The higher expedience of the girls’ distribution is because of the concentration; their distribution’s peak is more slender and higher than that of the boys.
Girls were more successful at exams than boys, by cheating or otherwise.
By technicality of field, 🧑🔬vs. 🧑🎨?
Since the distribution consists of 8 engineering fields and 8 non-engineering fields, it only makes sense to compare the two.

Plot Comment: The distributions of both are very different, in 2020 the non-engineering distribution is highly concentrated, hence it has higher expedience as compared to the engineering distribution.
One striking difference between the distributions is that the non-engineering distributions (although concentrated in 2020) are more spread out than the engineering distributions. This is mostly due to the high variation in non-engineering courses. For instance, non-engineering contains both LL.B (law) and B.Ed (education).
The higher expedience of non-engineering may also be owed to the fact that some non-engineering exams are easier to cheat in. For instance, in 2020, 25.3% of non-engineering students got a GPA of 10. Whereas for engineering, only 5.6% of the students obtained a GPA of 10. For 2019, the number is 0.295% and 0.016% for non-engineering and engineering respectively.
Since engineering and non-engineering have high variation in terms of courses, let’s look at these individually.
Grouped by Course, Engineering ⚙️
Here are the engineering distributions ordered by increasing expedience:

Plot Comment: Two points that stand out on observing these:
- The 2019 distributions look similar across the courses, they even have similar means (μ).
- The 2020 distributions look different across the courses, the range of means is high (min:8.78, max:9.32). This was a strange find, it’s as though the sincerity of a student may be correlated by their field. I wouldn’t have thought there would be such a difference in the 2020 distributions. Before plotting, I expected comps and I.T to have higher expedience owing to their technical familiarity with computers (which would give them an edge over the other branches by use of more advanced methods of cheating). But mechanical has the highest expedience. Look at that peak!
In my college at least, I know that mechanical has higher unity as compared to the other branches such as computers, this most certainly allowed them to be more successful in their efforts. Unity probably isn’t the only reason, maybe the branches with lower expedience were subject to more stringent exams.
Grouped by Course, Non-Engineering 🎨
Non-engineering distributions sorted by expedience:

Plot Comment: The high variation in these plots stands out, here too everyone cheated, but some (B.Com) to a much larger extent than the others. The range of expedience is massive here from 1.11 to 8.7!
Another thing to note is that even in M.M.S (postgraduate), expedience is evident. I wanted to plot these for M.Tech and M.Sc courses but didn’t cause of various constraints. I’m sure they also would have cheated to varying extents.
Grouped by Engineering Colleges 🏫
Two questions that I had on my mind before this grouping was:
- Some colleges are better than others, would the students in these better colleges be better at cheating too?
- The disposition of the students is shaped by how the college administration manages them. For instance, consider FCRIT, a college known as the Central Jail of Vashi, where you are fined if you don’t attend the college fest, what would the expedience be for such a college? Would such daft and draconian approaches to running a college affect the tendency of its students to cheat?!
This section attempts to answer such questions.
Checking correlation
To answer the first question, we can plot the 2019 averages (mean, median, and mode) against expedience to check for correlation. Here, r is the Pearson correlation constant, it ranges from -1 to +1, a value of 0 means no correlation, check this image to understand what the value of r means.

Plot Comment: From the above regression plots, the averages have a positive correlation with expedience. Not very high, but positive; with mean (μ) having the highest correlation. This shows that to some extent students in better colleges are indeed better at cheating.
Note: Here, better college = colleges having a higher mean GPA, not higher packages.
Colleges sorted by descending expedience
For the plot below I have sorted the colleges in descending order of expedience and selected the top 8 colleges.

Plot Comment: This is almost too good to be true, FCRIT is first (out of 61 institutions) with ψ = 9.29. Their 2020 distribution is a spike! This answers the second question, seems like the strictness of FCRIT administration has backfired. This is almost like how the children of strict parents tend to lie more. Good going FCRIT management.
Just want to mention that I had framed the question before I generated the above plot; I fell off my chair when I saw it.
Colleges sorted by ascending expedience
Similar to the above plot, here’s another one but sorted by ascending expedience.

Plot Comment: Notice that the 2019 means of the above colleges are mostly lower than the 2019 means of the colleges in the descending expedience plot.
A few handpicked distributions
Here’s another set. These distributions are of kinda well-known colleges that did not appear in the above plots

The only reason I have included these is cause I’m a data point in one of the above pink distributions.
Grouped Branchwise, Intra-college 🌴
The awesome thing about such collections of data is that you can check for measures such as expedience at any level of grouping. For example: are mechanical students across all colleges always the most expedient? Here are two (expedience sorted) sets of distributions to answer that:

Plot Comment: The above distributions are of all the engineering branches from the college DBIT. The mechanical branch has the highest expedience and computers the lowest. I wonder why is there such a stark difference!?
Here’s another set from a different college:

Plot Comment: This is from FCRIT, it has one extra branch (electrical) over DBIT. Here EXTC has the highest expedience; the difference between the lowest and the highest is much starker than the previous set! Students from FCRIT, I laud you for your unity; I could only hope for this level of collaboration!
Closing Section One 🚪
This is the end of the data plotting section. You may have your own set of questions that you would like answered, for instance, you can plot the 2019 distributions subject-wise to check which electives are more scoring.
So, I have put up all of the data and code I have used to generate the above plots in this Github repo. I urge you to go and play around with the data, you may find interesting things that I may have missed out on.
If you have obtained the mark sheets of other branches, other than the ones I have included that you would like to analyze, you can check these sets of notebooks and other files I have used to clean transpose the data into csv files. Although be warned the code there is an absolute mess and consists mostly of incomprehensible regex.
In the next section, I have laid out some of my thoughts with respect to this whole event. So it is skippable, like who doesn’t have opinions nowadays?! But, if you are a student planning to flame me for ratting you out, please do read the next section. I’m on your side; what passes for education here is a joke.
Note (edit): I’ve been told the second section is a more interesting (and relatable) read compared to the first, so probably don’t skip it.
The Genius Batch of 2020 or: How I learned To Copy and Love The Uni

Does anyone remember this Naruto episode, the trick to succeed was to use one’s skills to cheat. These Mumbai University exams felt the same way. Given high amounts of redundancy in what is being taught (with respect to what is required), and exams not actually testing for knowledge but rather the ability to memorize, why take the hard path i.e. actually study the syllabus?
These exams felt like a challenge in finding alternative paths that minimize the amount of effort required to reach the same end goal as before, getting a good GPA. In engineer speak, increasing exam giving efficiency; and boy were we efficient this time!

Disclaimer: This section lays out a few of my thoughts regarding this event and the way undergrad education is handled. These are colored by my experiences as a Computer Engineering student in a lower-mid tier college under the Mumbai University. Depending on the institution you belong to and your personal circumstances, our experiences may differ to a great extent.
I have, to the best of my extent, tried to view things from multiple angles, but like most humans, I’m flawed and have blind spots. So, if I have offended anyone, know that this isn’t my intent.
Implications Of Everyone Cheating
Well, now that everyone is aware that most (if not all) of the students had cheated. What now? Will the world collectively invalidate our scores and ask us to write the tests again? In an ideal world, where education didn’t have a commercial bend to it, this would be the case. In a world where the primary purpose of institutions, such as colleges, is education, this would be the case. Fortunately for us, this isn’t the world we live in.
The fact is, if you are a student, there is a whole lot of money to be made off of you. If the flow of students is stopped due to them having cheated, businesses such as grad schools would suffer massive losses. Colleges would have to pause intake until students do their exams right. Not to mention the hit employers hiring freshers would take.
Of course the above is a bit of a one-sided view of things, but that is the side that decides what happens of the students that cheated. It is not in the best interest of that side to acknowledge that you have cheated. After all, the fact that we have a terrible education system doesn’t change or cause anything.
Year after year, students graduate from colleges under this terrible system and become functioning members of society. Our country hasn’t imploded because of our education system yet. It’s just lagging behind.
The reason for this is that, colleges the way they are, aren’t meant to be primarily for education, that’s just a pretense, they are a hurdle you are supposed to cross to get to the next stage of your life. If you were to complete an entire engineering course but don’t obtain a certificate, the amount of money that you make will be much less than if you do obtain a certificate. The certificate signifies that you have crossed this hurdle. This is something economists call the Sheepskin effect. So the way things are, that certificate is something that you absolutely need.
How To Get That Certificate?
The question is, given our circumstances, what’s the best way to obtain that certificate? The issue with the sincere approach is that these two points:
- Gaining competence in a certain skill, sufficient to be valuable.
- Obtaining good grades across all subjects in a sincere manner.
are diverging targets.
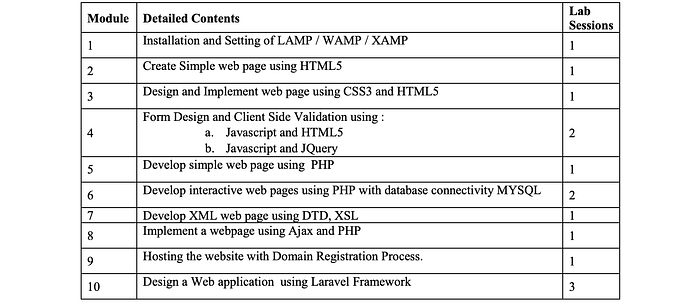
For instance, consider this 👆 excerpt pertaining to the Web Design Lab, a subject from the 5th-semester Computer Engineering curriculum. A single lab session lasts for 2 hours. 8 hours is most certainly not enough to learn HTML, CSS, Javascript, and JQuery to be competent in either of those, especially if you have no programming acumen. These topics aren’t even mentioned before the lab, they have to be learned and utilized as instructed in the given time of 8 hours.
The curriculum doesn’t allow one to specialize, or to be competent in a set of topics. It’s a buffet where you have to eat everything. The curriculum tries to get you to be aware of a large number of topics under a certain field. Even the redundant parts. I say tries because it fails to do so by not allowing the students sufficient time to apply what they have learned.
On top of all of the above points, the curriculum is unreasonably crammed. So if you do have to apply the things you have learned, it will be at the cost of other academic-related things. Basically, it is impossible for you to actually follow the curriculum sincerely. I highly doubt that even the people who set the curriculum would be able to follow it successfully and sincerely.
So, given the freedom of online examinations, your target as a student should be to obtain as high scores as possible with the least amount of effort. Your conserved efforts should instead be put into the subset of topics that you care about, or topics that make you valuable in the eyes of the industry.
Note: After writing this section, I found the updated syllabus (2021). Web Development Lab is now a subject called Internet Programming (pdf link: original, reuploaded; page 22) that has no lab work, only a mini-project. This means that technologies such as React.js are going to be taught on a blackboard or by use of dreary slides. Someone please stop Mumbai University, they’re making cool things terribly uncool and dissuading the students from actually going and learning it on their own.
Copying Is The Right Move
In our present situation i.e. exams conducted online as a safety measure against the pandemic, and atrociously assembled curricula, copying seems to be the right move. If you aren’t caught doing so, no one seems to care how you got there.
That is, no one will care if you are competent. People flaunt their credentials only when they have no other proof of competence. Einstein isn’t called Dr. Einstein. You must have come across such people, they’ll use any opportunity they can find to mention the fact that they have a Masters's or Ph.D. in some field, such people often live rather dull and uninteresting lives, don’t be such a person.
With respect to maintaining sincerity when it comes to exams, consider these two situations:
Sincerity, at the student level
Imagine you’re a student studying Computer Engineering. In the previous semesters, you have obtained mostly sevens and maybe one or two eights. It is the final year, and also your last chance, you have to try your best. You spent a good amount of time studying hard. Being a sincere student cheating to get ahead did not even come to your mind. The results have been released, hastily you scroll to your scores. You see that you have gotten a GPA of 8.79. You are ebullient, your hard work has paid off.
Curious about what your friends have scored, you start checking: 9.85, 9.24, 9.58,… How?! Did everyone copy? What has all your hard work been for? All that time spent in understanding Automata Theory, was it a waste?
It’s placements season, the students who, instead of ‘studying’, spent their time grinding Hacker Rank and DSA have grabbed packages upwards of 6 LPA, while all you have managed to land is a measly 3.2 LPA, the lowest tier in your college.
While this may seem unlikely, it isn’t. There do exist such students. The fact is that if in 2019 you scored an 8.79, you would be ahead of 90% of the students who scored in the exams. In 2020, with this GPA, you would not even be ahead of the bottom 25%. Your efforts have been misplaced, and your sincerity isn’t going to get you money.
Sincerity, at the institute level
Imagine a similar situation at the institute level. To curb expedient behavior during the exams, your institute makes use of the best possible proctoring software. It has everything: tracks your eyes, records your screen, checks your mic, prevents tab switches, checks time taken to give answers, etc. Basically, you would have to be a 10x hacker to fool this system.
The exams commence. In the first exam, students are caught copying left and right. The first few students were martyrized. The system proves to be a strong cheating deterrent. In the next few exams, the system catches fewer and fewer students.
Finally, the scores come out. They are, as one would expect, normal. In comparison with other institutes that chose to not incorporate such a proctoring system, your institute appears to be terribly below average. Both the institute and students pay for the institute's attempts to maintain the sanctity of the examinations.
It feels as though the institutes are now well aware of the situation posed in the second example. In the second set of exams that were conducted online, the proctoring was much laxer compared to the first set of exams.
You could imagine similar situations at any level of the hierarchy, whether it is the student level, or the department, or the institute, or the university level. Attempts to preserve sincerity (against the grain) don’t work in your favor.
It Has Always Been This Way
The issue is that it is actually very hard to scale the testing of knowledge. The institutions attempt this by instead targeting a proxy, which is checking whether you have memorized a few things from the syllabus. This, along with the intents of everyone involved in an educational institution being misaligned, causes us to end up with low integrity systems such as the Mumbai University making us write their tedium-inducing exams that don’t test for anything of importance or relevance.
When we, the students gave offline exams, we knew with high chance, the exact questions that were going to be asked. They were mostly questions from the previous years with a few new ones sprinkled in. If you had a method, you could easily score a 9+ GPA with a few weeks of preparation of either memorizing or understanding a small subset of the syllabus.
I often joked that the only thing I got good at during lectures was drawing, cause of (lecture) hours spent doodling on the desk (using a pencil of course, I don’t vandalize with permanence). I wasn’t entirely joking, few weeks were enough to get good scores. I was present in the lectures merely to increase my attendance percentage. At the same time, not understanding the concept of “social life” meant that I spent my time in asocial activities such as doodling, noodling, or coding which left me with some industry-relevant skills.
Since actual knowledge wasn’t really required, few took the trouble to gain it. We merely copied the content onto our brains and pasted it onto exam sheets when required. Ask us about the subject a few days after the exam, we’re just gonna draw blanks. As far as the actual thing is concerned, this is just cheating with extra steps. Since testing for knowledge is difficult, similar approaches were taken by a large number of students for other academic deliverables such as projects. Teachers seemed to be oblivious to what GitHub is; convincing them of the originality of our projects wasn’t very hard.
In my class of ~70 students, there were maybe 5 students who had any coding know-how, this of course changed when placements season came, suddenly there was a rapid uptake of Java to solve Hacker Rank problems. My intent here isn’t to denigrate the students, I don’t think they (or the teachers) are to blame. My intent instead is to illustrate that over the entire duration of college, these skills weren’t required to get by.
Clearly, the solution to such a phenomenon (everyone cheating in online exams), isn’t offline exams. So then what is it?
Before Solutions, Understanding Underlying Problems
While I don’t know what the solution is, I have a few intuitions as to what one might look like, I may visit those in some future articles. For now (before approaching solutions), it’s more important to ponder about the underlying issues that cause our education system to be this way. Here are a few issues that I feel are the reason.
No Choice
In this country, going to college isn’t a choice, every child is shunted into some course for higher studies (post 12th standard). Most often, the parents make the decision for the child depending on what’s in. A few years ago it was mechanical engineering, now it is computer engineering. Both fields have been watered down with apathetic students being taught by disinterested teachers. Education pertaining to these fields is now suffering, and the talents of these misplaced students are unrealized.
Education in the country scaled to the students’ (or more aptly, parents’) demands, but any kind of secret sauce that could have made it special (or even useful) has been distilled into oblivion. Have you ever tried to prepare your special dish for a large group of people, only to end up with a soggy mess having incorrect amounts of salt? It’s kinda the same thing.
Misaligned Intents
Think of the tacit intents of the primary stakeholders of a college:
The Management: The success of a college as a business is measured by how much money it brings in. The tacit intent here is to maximize profits. A good example of a college where the maximization of profits faced backlash — because of their sleazy approach to it — is MITWPU, a college with “peace” in its name. The curriculum of this autonomous college included an International Student Tour (IST) for which the students had to shell out a large sum of money. Because of the pandemic, the trip ended up being a pipe dream. The college, not wanting to lose out on the money, decided to withhold the results until the amount had been paid. Facing litigation and backlash they finally acquiesced and offered three options to the students: 1) The IST; 2) Online Courses (extension of syllabus); 3) neither of the two with a refund of the money meant for the IST.
It’s quite obvious what the students chose. Of course, there are proper ways of maximizing profits, not all approaches to this are slimy. After all, running a college is a business, profit is an integral part of it.
The Teacher: A teacher tends to be gauged by how well their students perform. How well a student performs, according to the university, is of course measured by the marks obtained by the student. And so the teacher’s tacit intent is to try and maximize their students’ marks.
Some teachers manage to short circuit this by directly teaching the students to maximize the marks obtained in an exam. For example, the teacher responsible for teaching my class theoretical computer science was more concerned with how we drew our diagrams as opposed to whether we actually understood the concepts. “If your arrow doesn’t touch the circle you lose 3 marks.” Who cares what the significance of a Turing machine is anyways?!
The Student: Let’s be honest, most of us, for at least the first three years of engineering don’t even know why we are here. Around the fourth year, our intent (tacit or otherwise) ends up being maximization of the package we procure. Even if we opt for higher studies the intent mostly is the same, a small delay to considerably increase the returns. Suddenly we start working towards this goal, whether it’s grinding Hacker Rank or the 5 lb. Manhattan book for the GRE.
This is a recurring point, education is a second-class citizen in our institutions of education, marks are what is important.
They promise education, but really they give you tests and scores — Killer Mike
In the first lecture (of any subject) itself, we are told the mark-wise breakdown of the syllabus. “Chapter 5 is important, study this well, it will come for at least 20 marks in your exams”, a dead giveaway of where importance is placed.
Neither of the three major stakeholders are working in the direction of education, nor are they incentivised to do so. The only reason why the system kinda works is that there is a slight intersection of these misaligned intents. If the college management has to maximize its profits, it has to ensure high placements. This to some extent depends on the kind of scores the students of a college procure. The responsibility for this (to ensure students procure good scores) falls on the teachers’ shoulders. It’s an unfortunate situation for the teachers. Who do you think gets blamed when the students don’t score well?
Teaching is Outdated
If you’re a teacher, I understand your predicament with respect to online lectures. There is zero feedback when teaching online, especially because the students’ cameras and mics are switched off. This is an extremely unnatural way to interact with someone. It’s like teaching through a one-way screen where the other side is soundproofed.
I tried giving a solo online presentation once. I had no way to know if what I was saying, was being comprehended or even heard because everyone’s cameras and mics were off. It was a very unnerving experience, a situation I never want to be in again. Teachers nowadays have to go through this day in and day out.
A few teachers told me that they were aware of the fact that the students aren’t actually present when they join online lectures (but I should still join because attendance is important). I don’t know if they realize the extent of the students’ absence. No one deserves to be this redundant. To understand how ridiculous this is, imagine teaching an empty classroom. At this point, why even keep lectures?
It feels as though, in the present day, teachers aren’t what we need. The hard-to-swallow pill for teachers is that, no matter what your subject is, there is someone on YouTube doing the teaching much better than you are doing it in the classroom or online lecture. If there isn’t then you could be that person.
One way to continue being relevant is teach in a more engaging manner, such as by incorporating your own subject-relevant experiences or real-world examples to provide context. Most of my teachers never did that. And even this could be pushed onto Youtube or some similar platform.
Why teach the same thing year after year? Recording the teaching once and being available for the solving of doubts seems like a no-brainer approach. Undergraduate studies seldom involve the cutting edge advances of a field; lectures taught 10 years ago would continue being relevant today. No need for repitition, especially when everyone has internet access (which is cheaper than a degree certificate).
There is no shortage of teachers, and there is no difficulty in accessing their teachings. What we need instead are mentors who are well versed with the landscape of their fields, and can guide the students to make rational choices with respect to their careers. The students are perfectly capable of educating themselves once you convince them to do so. For instance, when placements season comes around, no one forces the students to get jobs. They understand the significance of this and manage to do this on their own.
In fact, current teaching methods (akin to handholding) causes the students to continue being helpless. We are so reliant on the teachers for everything (remember pleading for question banks?), that we end up being blind to the vibrancy of our respective fields because we are limited by our teacher's knowledge. We seldom seek out beyond what is given to us. This mental castration causes students to seldom realize their potential. It constantly feels as though everyone is capable of so much more, but they weren’t given the opportunity to explore themselves. The sad part is that few realize this.
In 2021, even the current approaches to teaching feel highly outdated, I mean we were taught programming languages on blackboards! Why not at the very least execute the code and show us the output? I remember students copying down Python code (into paper notebooks) from the blackboard without the indentation, and then having a hard time running the code in the lab. This is so incredibly stupid. Online lectures should’ve been a wake-up call to switch up on teaching methods, or maybe even rethink teaching.
The Students Leave
Educational institutions have extremely high churn rates. The people who remain in the system are the teachers and the people who run the institutions, a minuscule percentage of the whole. Students, the largest percentage, leave once their course is over.
When a student leaves the institution they realize how bogus it was. At this point, the student wouldn’t care enough to raise their voice, and are instead just thankful that it is over. So, those that are most affected by these institutions, i.e. the students, end up caring the least about making any changes to it.
This realization doesn’t come to us when we are in the institution, because as I mentioned earlier we are reliant on our teachers. They are the primary authorities and sources of truth when it comes to information regarding what is going on in the field. The issue is that most of them aren’t in the field they are teaching about; unless they are actively involved in the field, their expertise is limited to the syllabus.
Closing Section Two
The way education is handled needs to be upgraded, almost everyone had access to the internet back in like 2015, six years later, the education system still ignores this fact and tries educating students like it’s 2004.
We are now in the second decade of the second millennium, is this seriously the best we can manage? Is this what the education system of an aspiring superpower looks like? Forget the flying cars and holograms, let’s first rebuild our education system!
Epilogue
The online lectures started when I was in my second to last semester. In the start, I attended the first few of them sincerely. It felt a bit like the YouTube videos I had used in the previous semesters to get by, albeit with much less production value, and without the ability to speed up or pause the playback (I remember involuntarily hitting spacebar to pause the stream). It wasn’t engaging in the least.
Concepts that took maybe one-two hours to explain in an online lecture, could be succinctly explained by a clever animation or a short youtube video in a few minutes, or if a detailed long-form format was preferred there was always open access to course material from revered colleges like MIT and Stanford. What exactly was the purpose of these lectures? To give the teachers something to do so that their pay can be justified?
The online lectures were a terrible waste of time. So I stopped attending them with sincerity, and instead resorted to logging in, giving my attendance, muting my tab, and then continuing to do the things that interested me.
I did this for all lectures barring just one, Development Engineering, this was because the teacher that took the class involved her own personal experiences (something didactic YouTube videos don’t offer) and real-life examples pertinent to the subject, she often strayed from the curriculum so as to be faithful to the essence of the subject. There was no other place where I could get what this teacher offered. It was the best class I attended over my entire three years (I joined in the second year) in college. Ironically, the subject had nothing to do with computers.
After speaking to a few students, I found out that almost the entirety of my class was doing the same i.e. logging in and tuning out. I didn’t like this façade, it was highly disrespectful to the teachers, they were putting in actual efforts and we were just pretending. So at some point, I stopped logging in, so as to end the false impression of me being there. I’m pretty sure in my final semester, my attendance was below 1%.
This caused a few teachers to ask me whether something’s wrong with me. After explaining my point, they all more or less said the same thing, which is that they knew many students weren’t actually attending, but attendance is important, so I should at least log in. This made me realize that this entire system is just absolute bs. I mean, I knew it earlier too, but this time the realization hit much harder.
Teachers are after all employees of the institution, they are being paid to conduct these lectures, they don’t have an option. Even if there’s only a single student, they’ll have to conduct the lectures. Similar constraints are placed on students with the attendance criteria. To a huge extent, no one cares what is actually going on as long as targets such as these are met (for example, 25 lectures conducted by the subject teacher, and at least an attendance of 75% by all students).
When a measure becomes a target, it ceases to be a good measure. — Marilyn Strathern
A quintessential example of Goodhart’s Law. The system doesn’t award the teachers for the students’ actual successes. When they do something to ensure the success of a student, it is out of their own goodness.
The situation was the same when lectures were offline, but since the interface of video calls wasn’t used, and attendance was upheld with much strictness, students had to sit for the lectures. Why does attendance up to 75% have to be compulsory? If the lectures were top-notch and pertinent, wouldn’t the attendance end up being close to 100% without making it compulsory? Society doesn’t praise people for attending lectures and then landing a job, we laud the dropouts who become multi-billionaires. Only the social aspect of college seemed to be of actual importance. Attempts at education by the university were a joke.
This year I completed my undergrad course in Computer Engineering. Felt like I had wasted three years of my life. Everything could have been done better. If I did have to study Computer Engineering to get educated in the field, all of it could have been done much better in a shorter period of time. And from procuring a job standpoint, probably not even a year would have been required. Ultimately what got me a job (in Software Engineering) were the set of skills I picked up in my free time, not what I was taught in the lectures.
At the end of it all, I was extremely frustrated and dissatisfied with how the entire thing was handled. I felt like I owed my experiences to other students so that they can perhaps better navigate themselves in a system that isn’t aligned in their best interest. I got the perfect opportunity with the data to illustrate my point that this doesn’t work like you think it does, and so I ran with it.
I vehemently feel we can have, and deserve a much better system, one that actually does what it is meant to. There’s quite a lot more that I have to say in this regard, but the article may already be too long for most people, and maybe like one person will read it (hi, Badshah), so I’ll perhaps save it for another time.
Before I end this, I want to mention that I am highly grateful to my teachers. If it wasn’t for them I wouldn’t have reached wherever it is I am, and wherever it is that I will go. I won’t remember them for the way they taught, but instead for the people they were. Most of them were highly supportive, benevolent, and understanding, I am lucky to have known them.
This article took nearly three months to complete, most of this time was taken to wade through the data. So if you read this post, irrespective of whether you liked it, my sincere thanks for reading it. 🖖